Preparing this in your language — reload in a moment.
Add a table that calculates, and a chart
Any table in a doc can calculate. Start a cell with = and it works like a spreadsheet cell — no separate sheet required — and a chart drawn from the table redraws when the numbers change.
- Insert a table
Inserir ▸ Tabela, then pick a size. Typing @table on a new line does the same.
- Type the inputs
Labels and numbers in their cells, the way you would in a spreadsheet: each channel, its Q3 sales and its growth.
- Start a cell with =
**=B2(1+C2) for a target, =SUM(D2:D4)* for the total. When you leave the cell it shows the result, and the table now calculates.
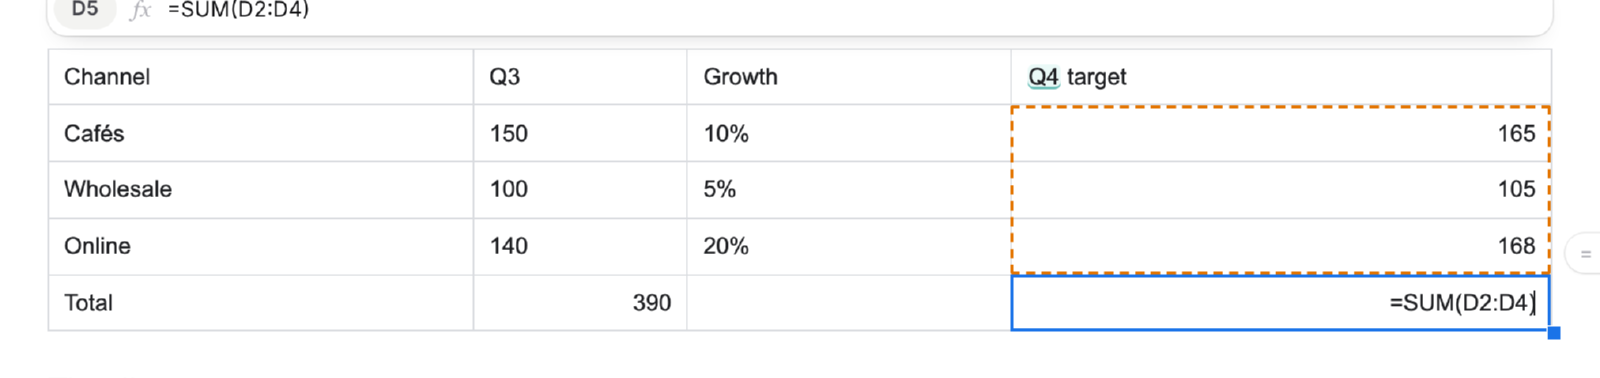
A cell that starts with = calculates. Double-click to see the formula.v2026-11-18 - See a formula again
Double-click a result, or press F2 on it, to show its formula and change it.
- Draw a chart from it
With the table selected, Inserir ▸ Gráfico — "From this table". The chart sits beside the table and reads from it.
- Change a number
Type a new growth rate: its target, the total and the chart follow at once.
Need a whole spreadsheet instead? See Work in a sheet.